Measuring Interface Consistency
In this article I’d like to overview the approach which we used at AliExpress to understand how bad our interface was in comparison to the competition. In terms of constraints, we’ll look at 4 major players in e-commerce marketplace space in Russian & CIS markets — AliExpress, OZON, Wildberries, Yandex.Market. Even though we’ll be focusing on specific markets, it’s very easy to use the same methodology on any other market or industry.
For Russian-speaking audience there’s a video available on YouTube from Tinkoff’s #FFDD2D Design Conference with my talk, and you can view slides in Figma. For English-speaking audience I suggest to view this keynote in Figma, or to read the article following below.
You might use the same approach if you understand that there are some problems with the interface in your product, or you might think there might be a need for a rebranding. You can use the current approach to have a leverage over stakeholders and prove your points with data and numbers. And, you know, it’s hard to argue with numbers.
What you will have on hands after reading this article
- Evaluation of the interface consistency for your product and benchmarking of it in relation to the competition.
- Leverage towards business and product stakeholders from the design stand point, ability to easier integrate tasks for design improvement into the product strategy and OKRs.
- Justification of the necessity for changes in the product in terms of visual communication and design: why it’s important to make it consistent and systemize it.
Why to measure the consistency in AliExpress case?

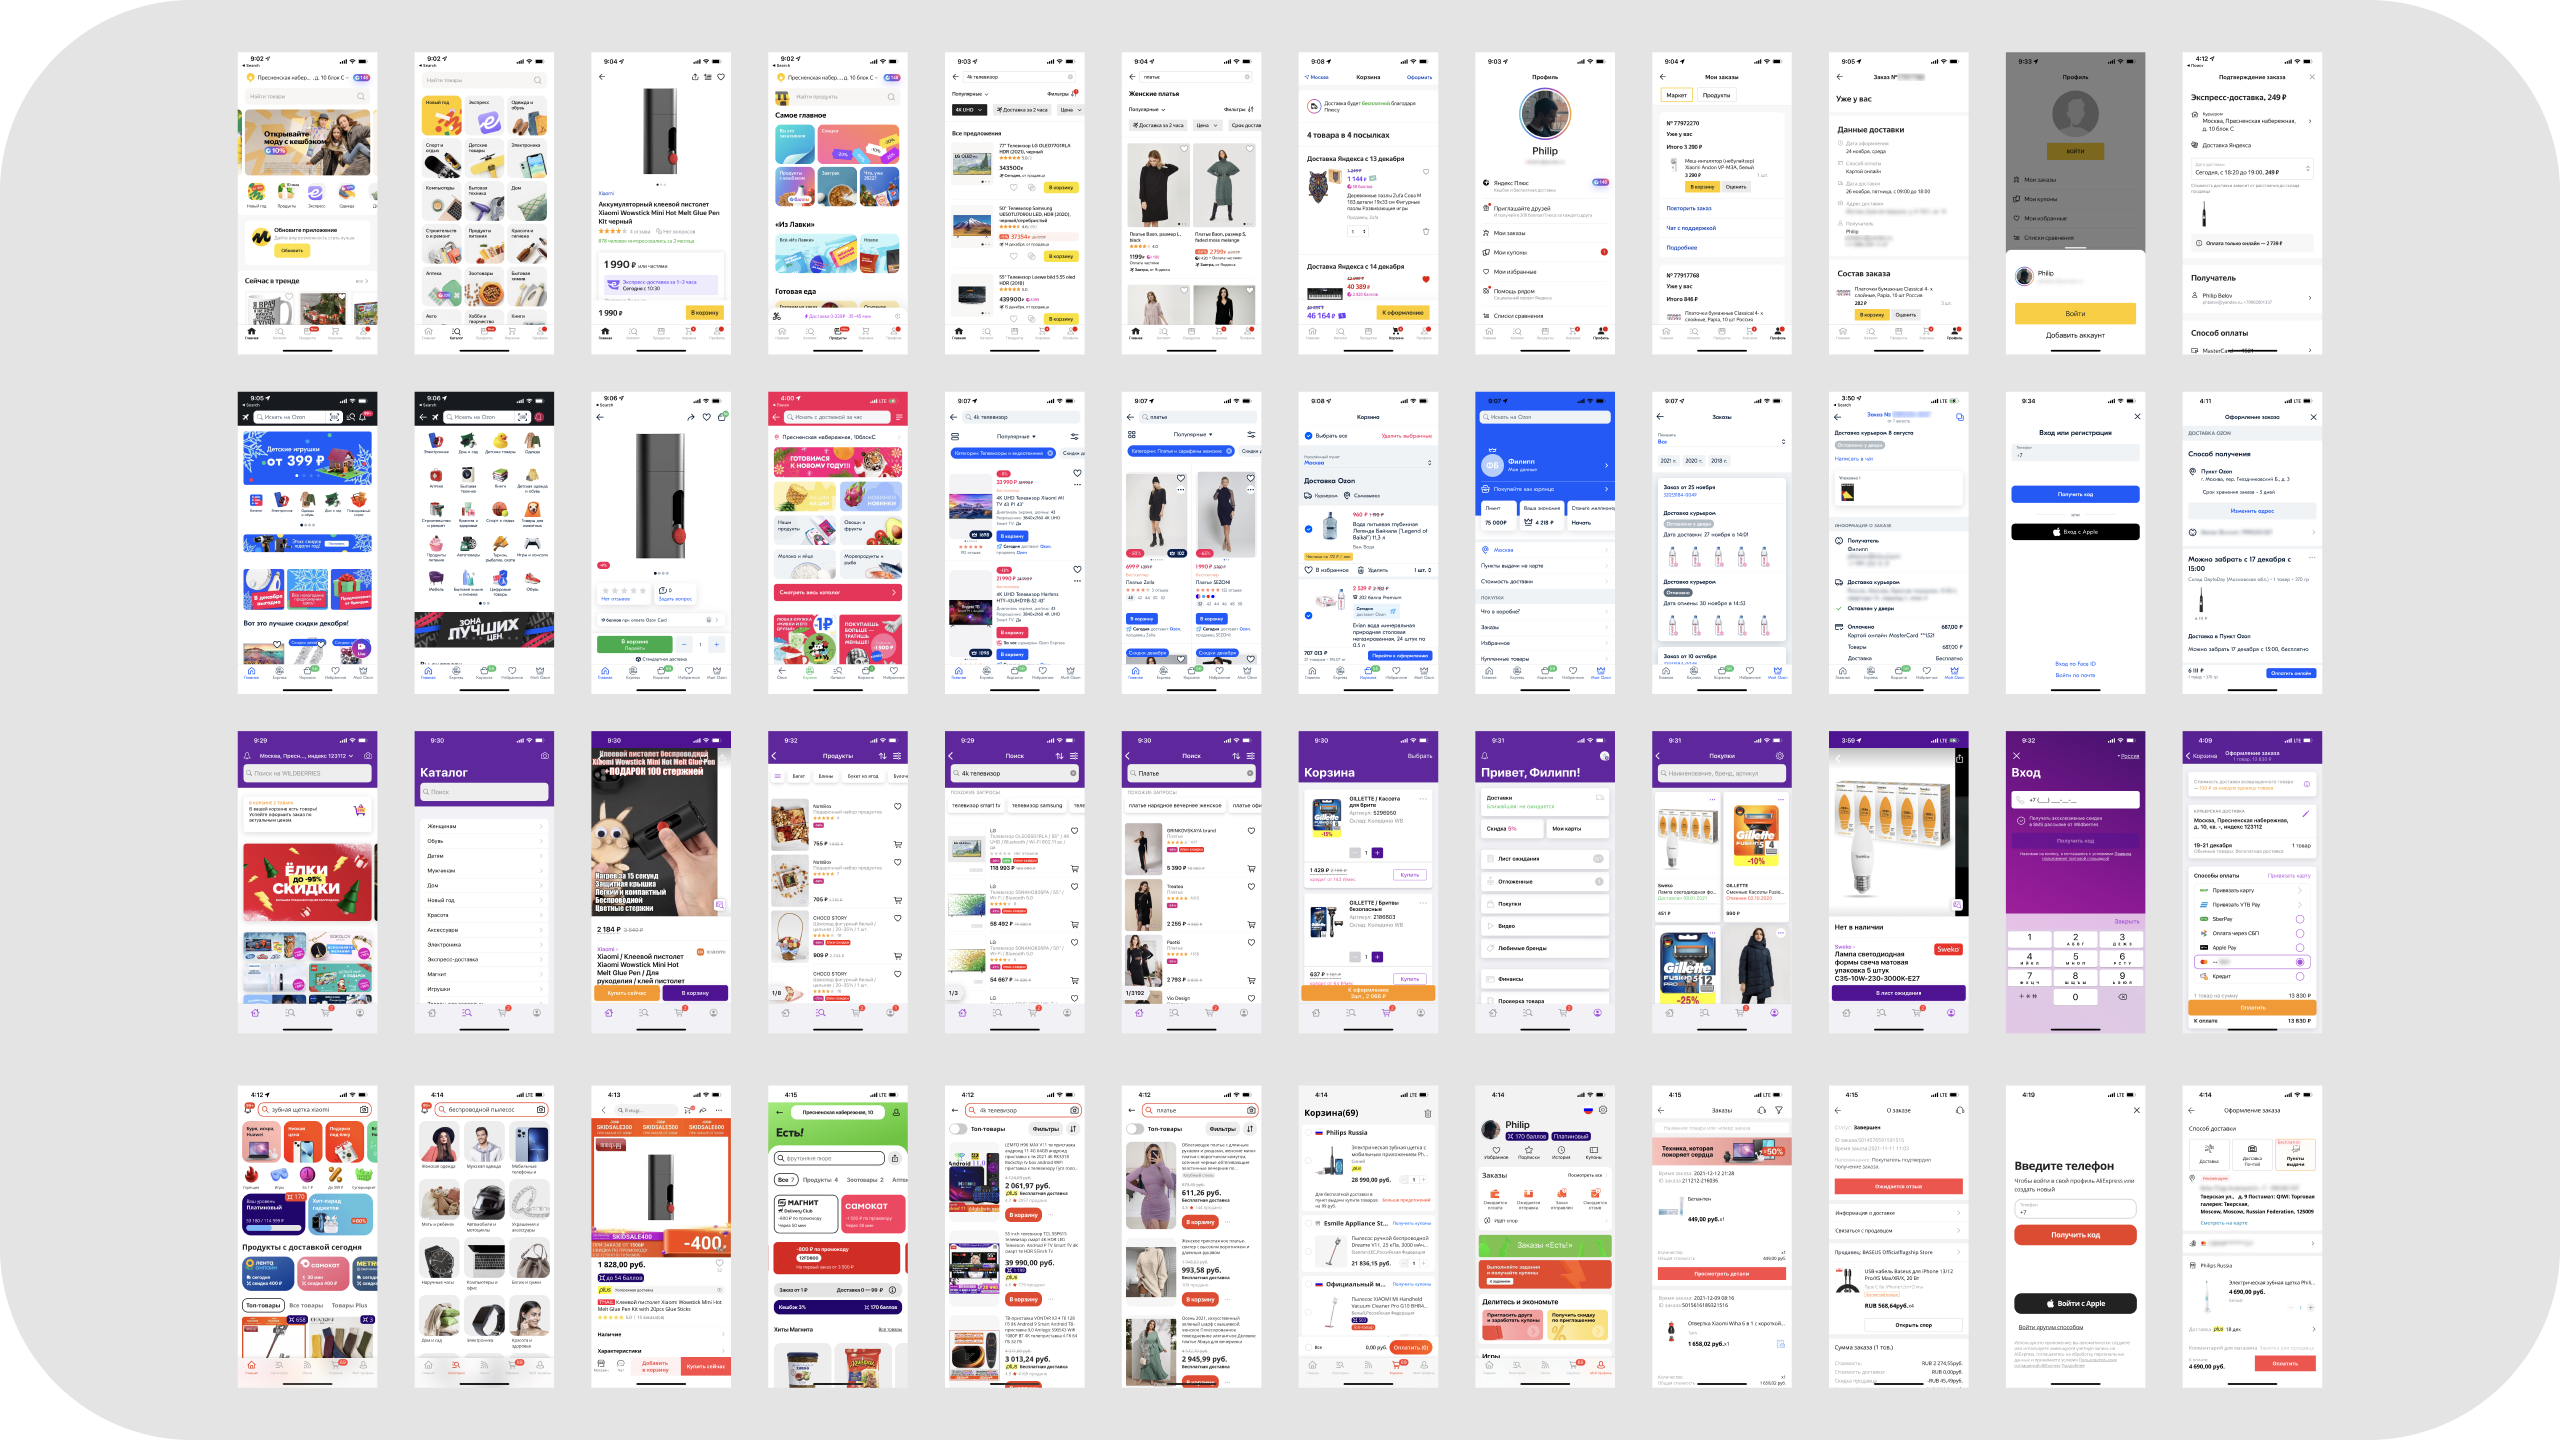
Representation of the vast differnce of interfaces and communication materials of AliExpress as of March 2021
Well, if you look at the image above, it’s kind of obvious that the overall situation in terms of design is bad. Though, company and business has of other priorities not related to design, and so it might be a good idea to show how much the company might be losing if it continues to live in the same state. There are a few more points which might explain why, in general, it’s important to measure interface consistency.
1. Company might be losing money or not profiting from what it might potentially be profiting from
There’s a research done by once per 3-4 years by Lucid Press — The State of Brand Consistency. Its goal is to explain that if the company has inconsistent communication across all the mediums, it might be earning less than if such communication was consistent. For example, in the research for 2019 year it’s stated that a company, which implemented consistent brand communication in visual and verbal formats, might increase revenue on average by 33%.
2. The goal of having a leadership position on the market might not be possible to achieve
The product is (subjectively) far behind the comptetition in terms of interface quality, communication in the product, and thereby, to some degree, also is the business.
3. Ideology and responsibility towards users
As designers, we’d like millions of customers to look and interact with something of a high quality, be it banners, copy or the interface.
4. Perception of the company inside and outside
How your company looks and feels affects the motivation of the employees, their mood and goal-orientation — on the inside. The image on the outside can affect whether you’ll be able to hire and attract great talent. It’s better to build something cool and looks good, rather than tackling with something which feels mediocre (in most of the cases).
Methodology
1. Choose a platform
In our case it was mobile application for iOS. If your apps aren’t different very much then you can limit yourself and save some time by just focusing on one mobile platform. For us such restriction was viable. We also avoided desktop, as most of the traffic and user base are doing purchases using mobile app.
2. Make screenshots of all the key product screens
Screen set of your product and competitiors’ should match, as later we’ll be making a set of comparisons to calculate the consistency metric.
For us it was the following set:
Screen set of your product and competitiors’ should match, as later we’ll be making a set of comparisons to calculate the consistency metric.
For us it was the following set:
- Login / Registration
- Home
- Search results
1. Grid
2. List - Product detail
- Cart
- Place order
- Orders
- Order detail
- Profile
- Catelogue
- Supermarket / Express (FMCG)
Screens of iOS apps, from top to bottom: Yandex.Market, OZON, Wildberries, AliExpress for December 2021. In each column – similar screens from each app
3. Create questionnaire in crowdsource platform
For each pair of screens inside one app, create a task in crowdsource platform of your choice, making a question: “Is it true that both screens belong to the same application?”
In our case, as we targeted Russian & CIS audience, we used Yandex.Toloka. For internationally-targeted products, or the once which are targeted on the UK, US, or any other English-speaking markets, you can use Amazon Mechanical Turk, for example.
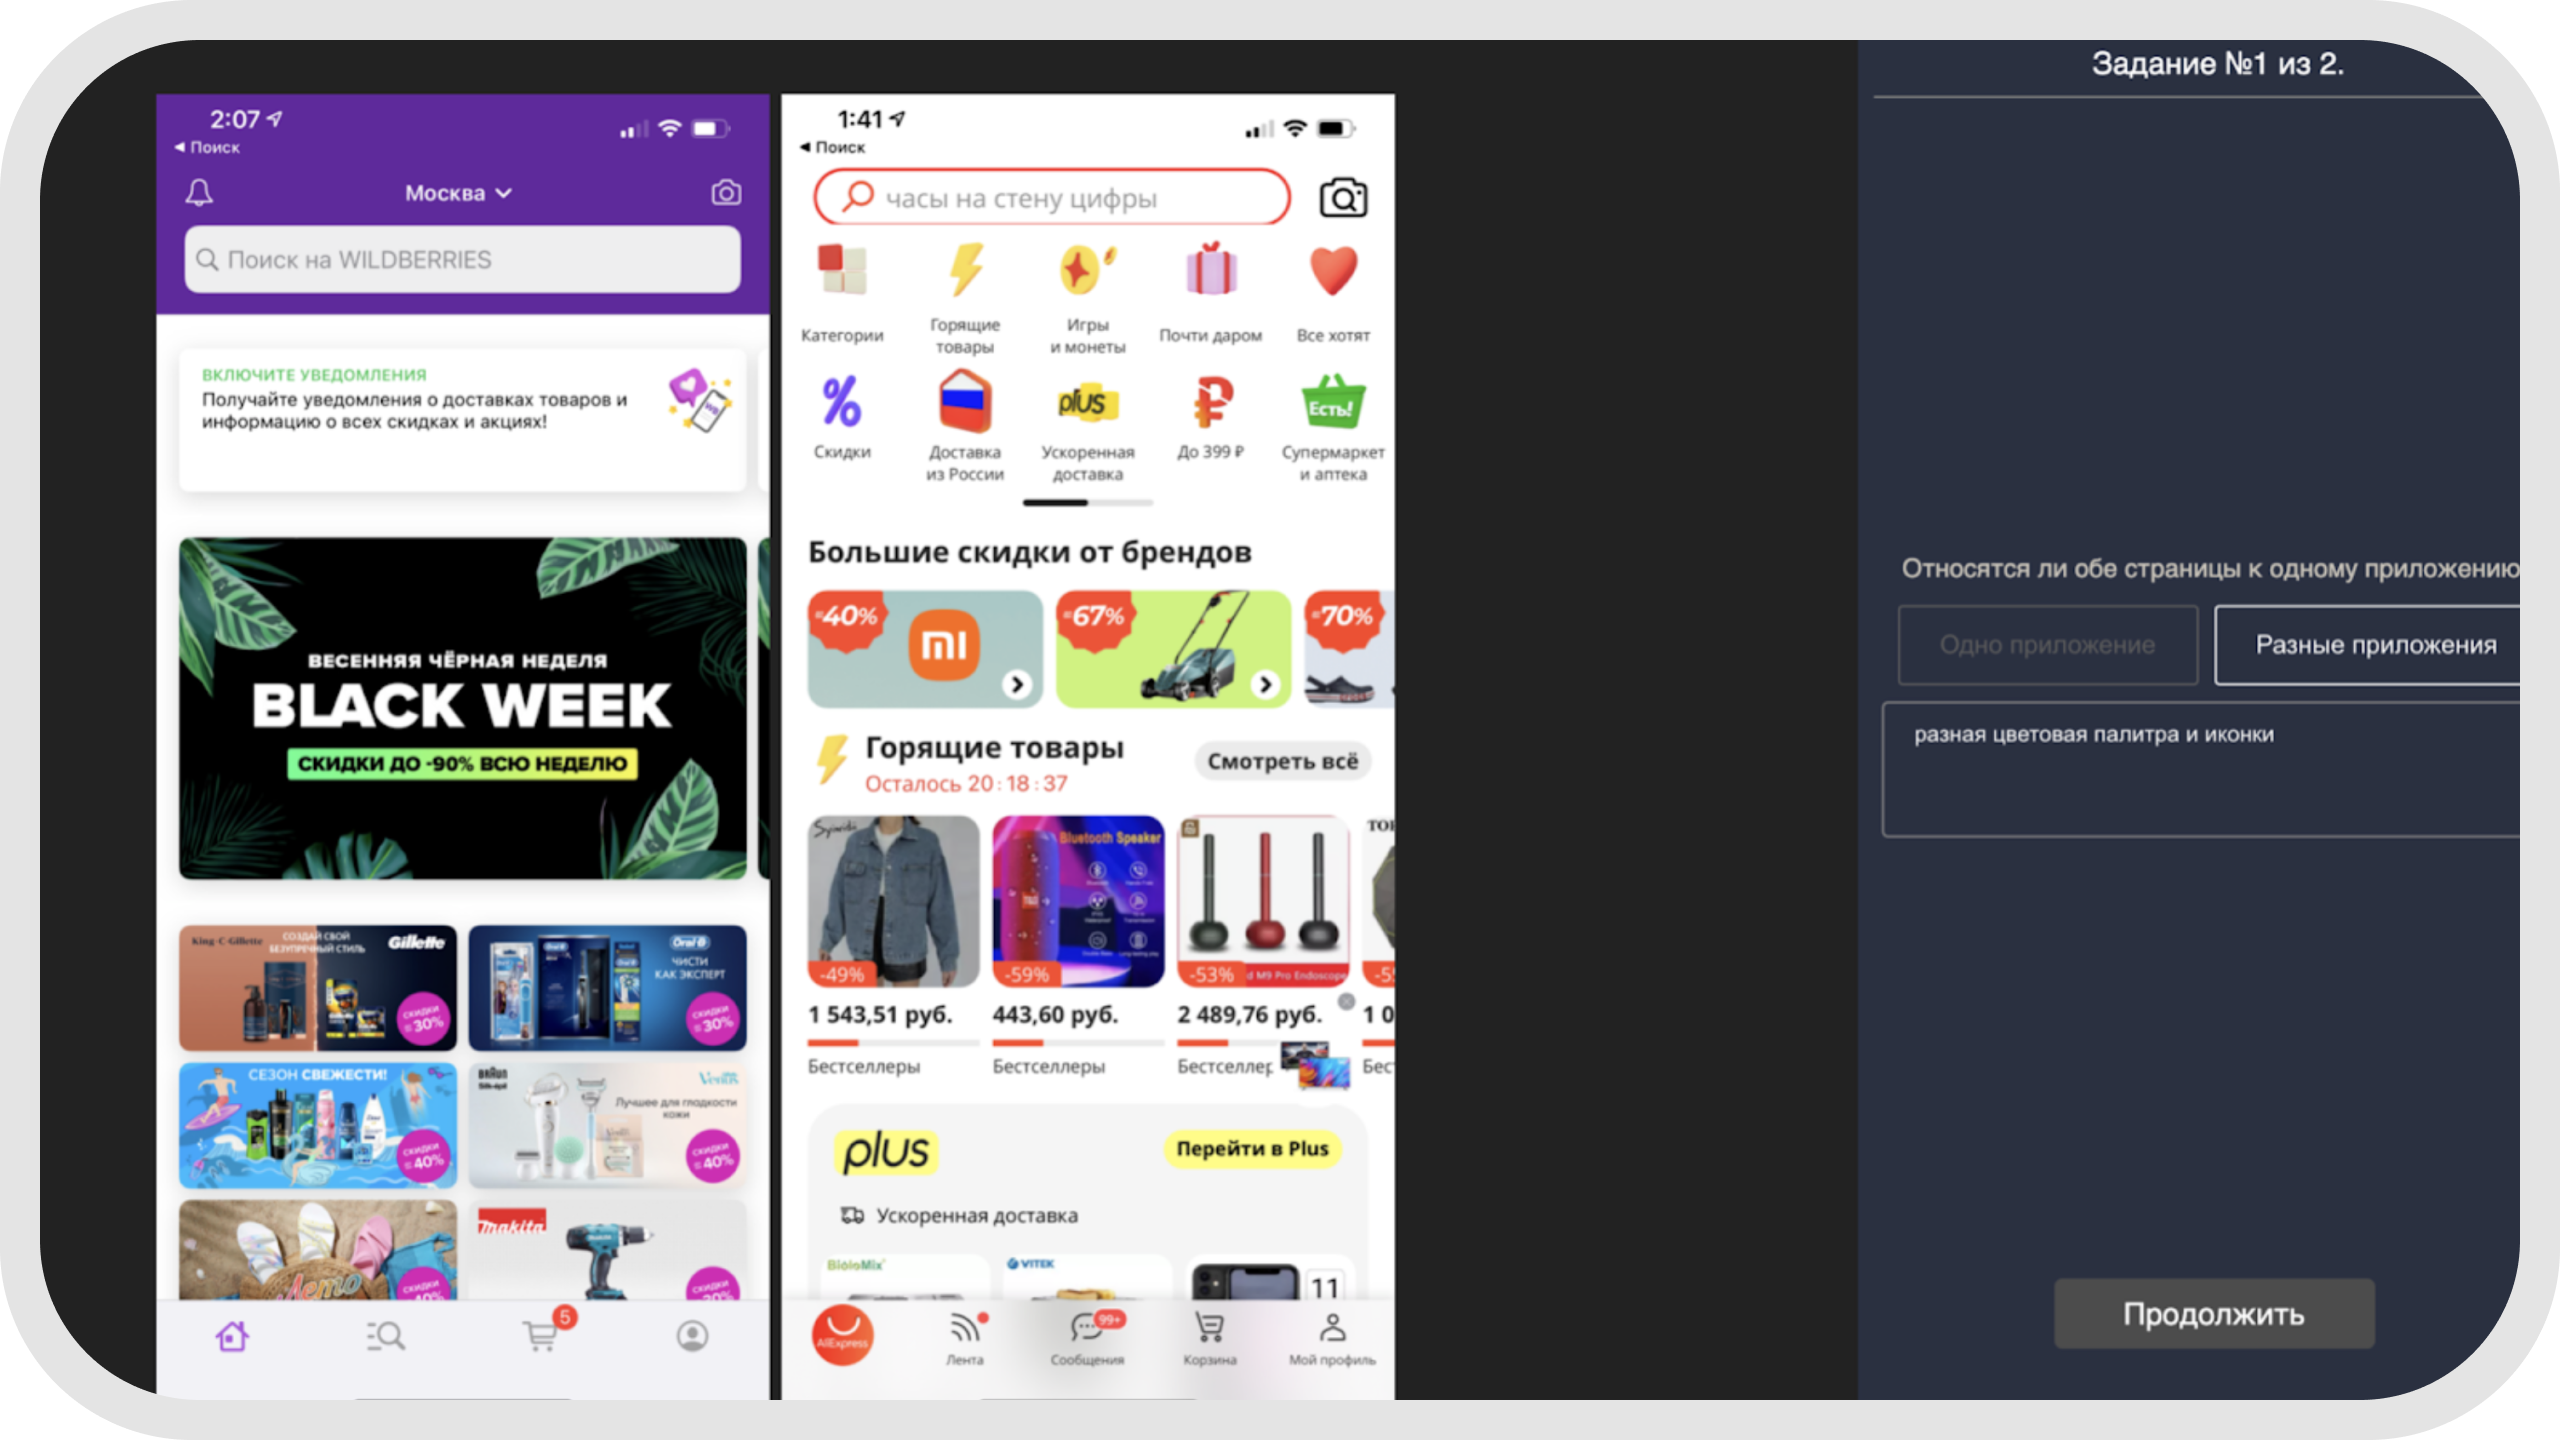
Interface of Yandex.Toloka and how the question screen looks like
4. Calculate the metrics
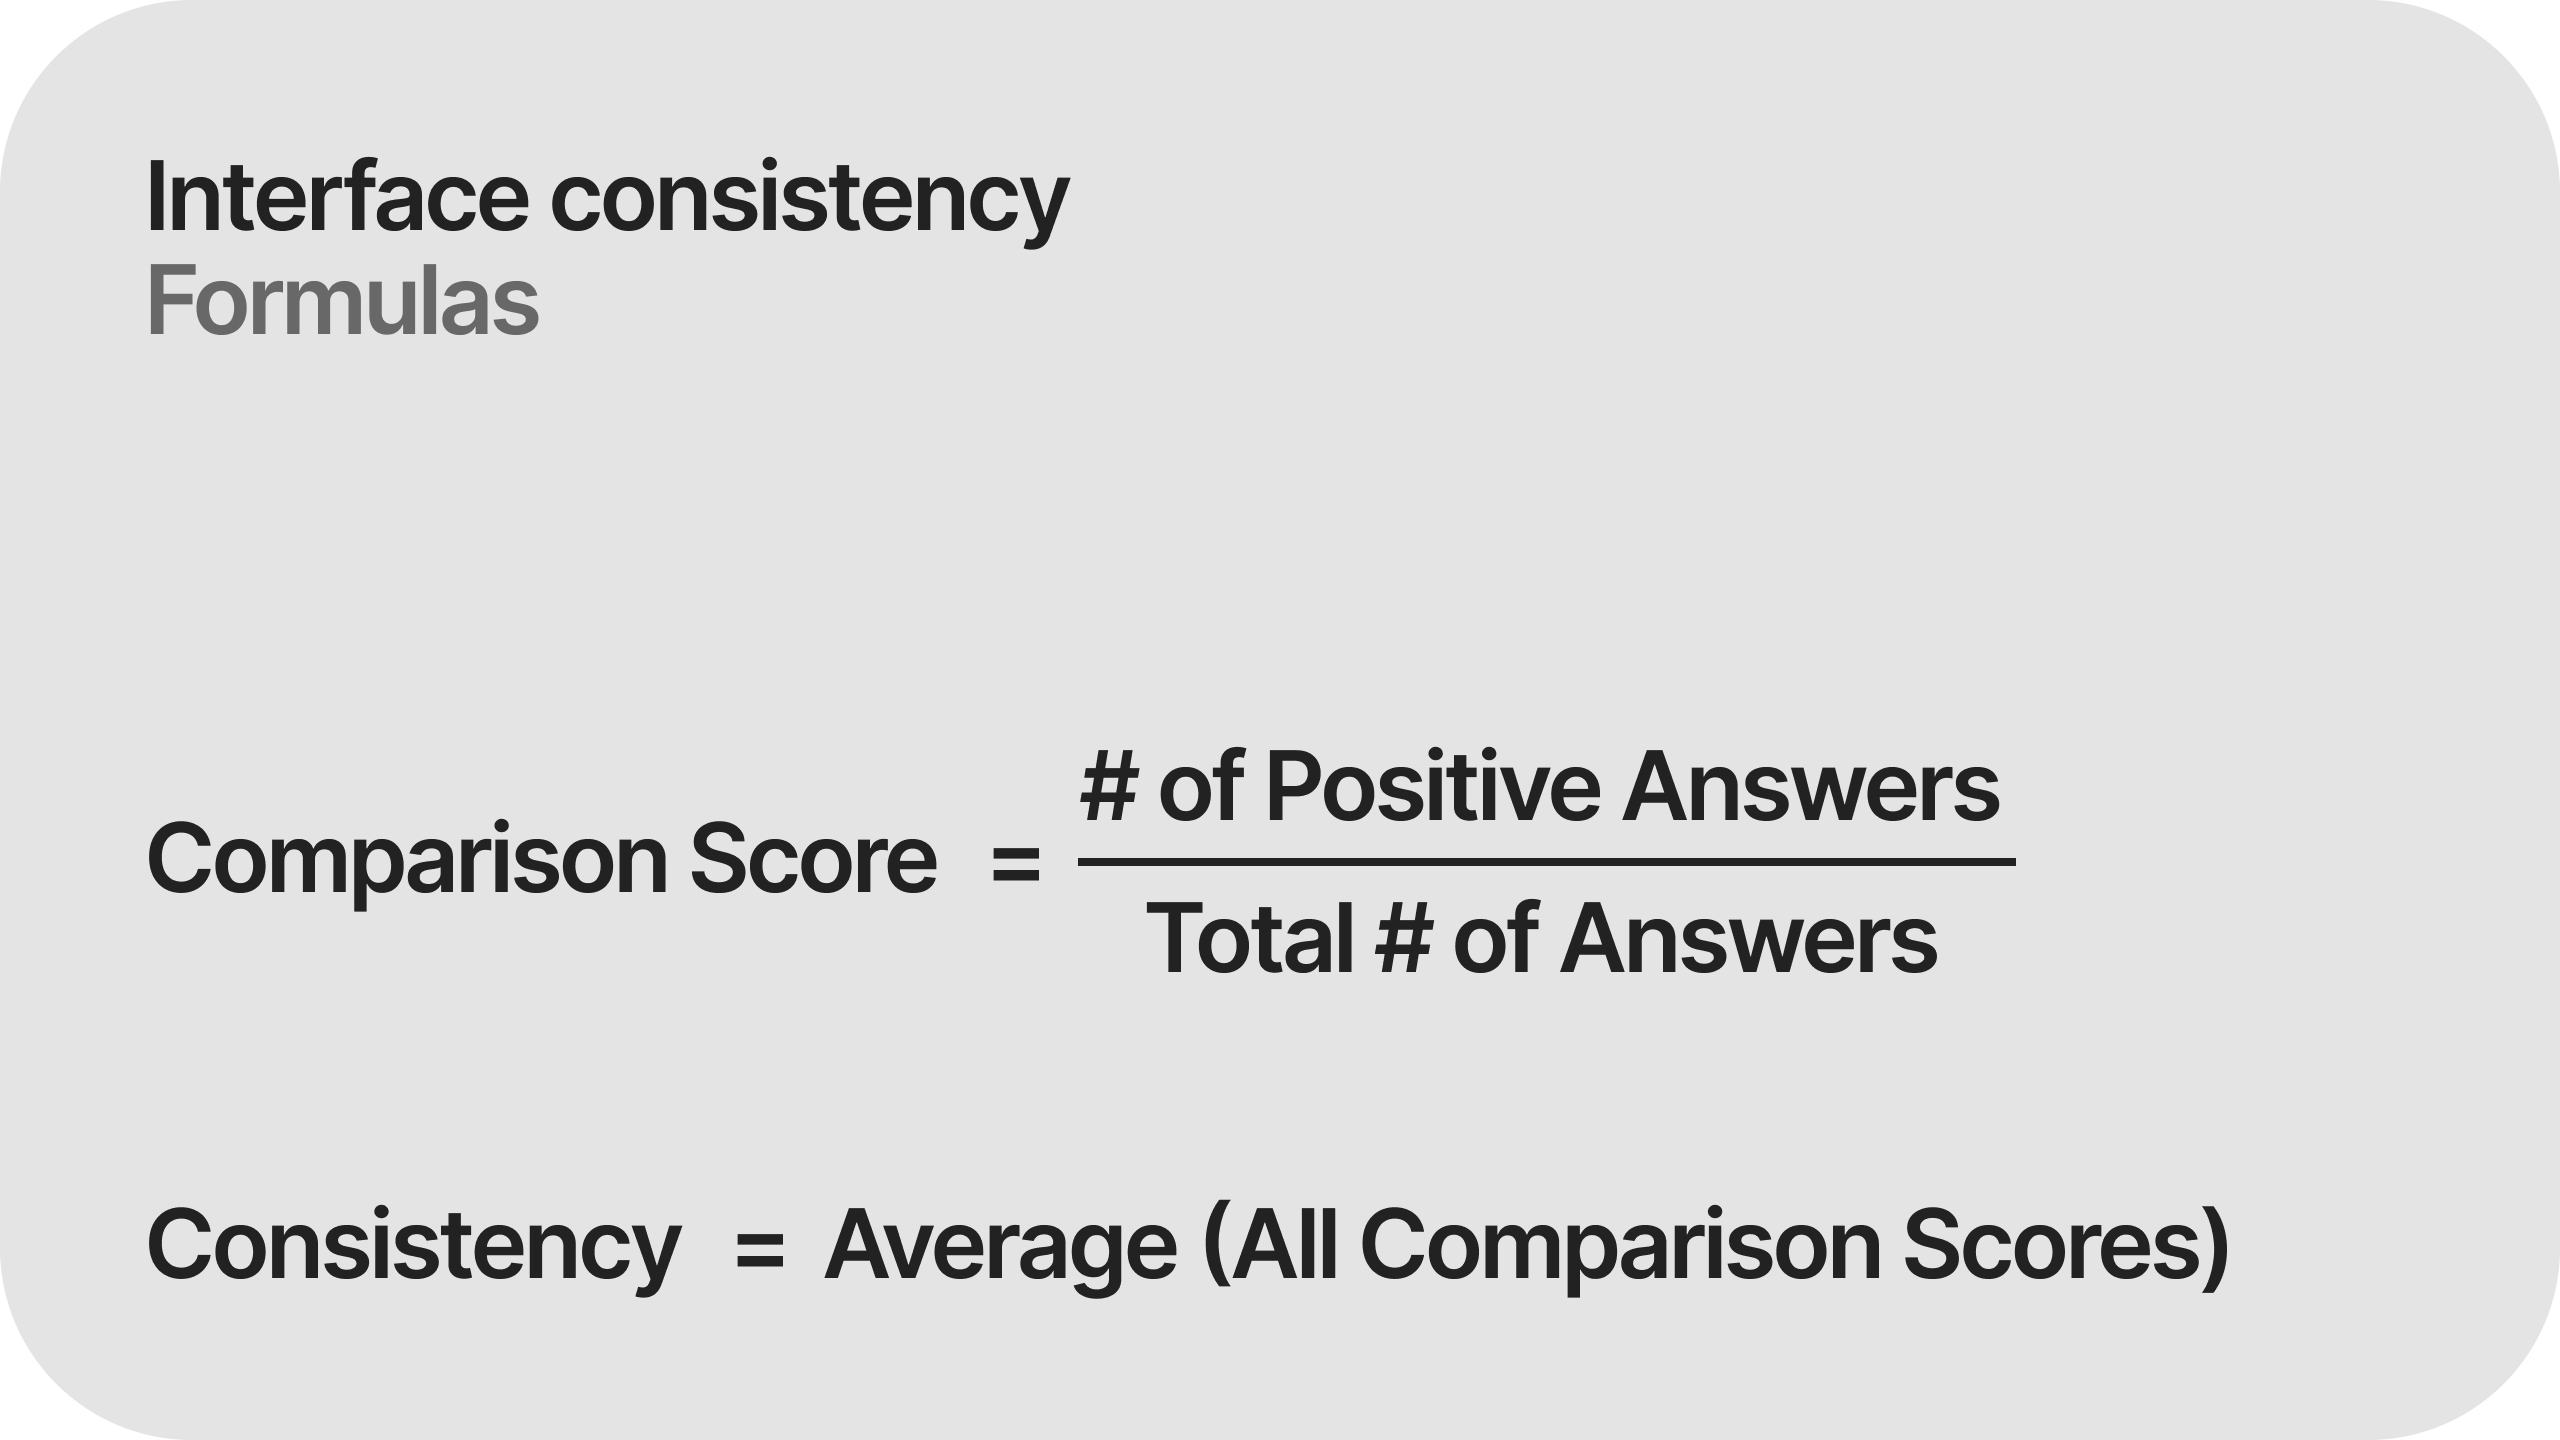
First, we need to calculate the Comparison Score for each set of pairs of the screens. To get its value, we need to divide the number of positive answers Yes, two screens belong to the same app to the question Is it true that both screens belong to the same application?
Comparison Score = # of Positive Answers / Total # of Answers
To get the Consistency metric you need to take average of all the comparison scores.
Consistency = Average (Comparison Scores)
5. Interpret and visualize the results
For convenience you can build a table (matrix), in which in rows and columns – screens of a particular product. In cells on the intersection of a row and a column there will be a Comparison Score for this pair of screens.
Compare our Consistency metric value with competitors, see which cells are colored in either orange or red. I.e. where the comparison score is low; in these screens, with very high probability, there’s inconsistency and one of the pair requires tuning).
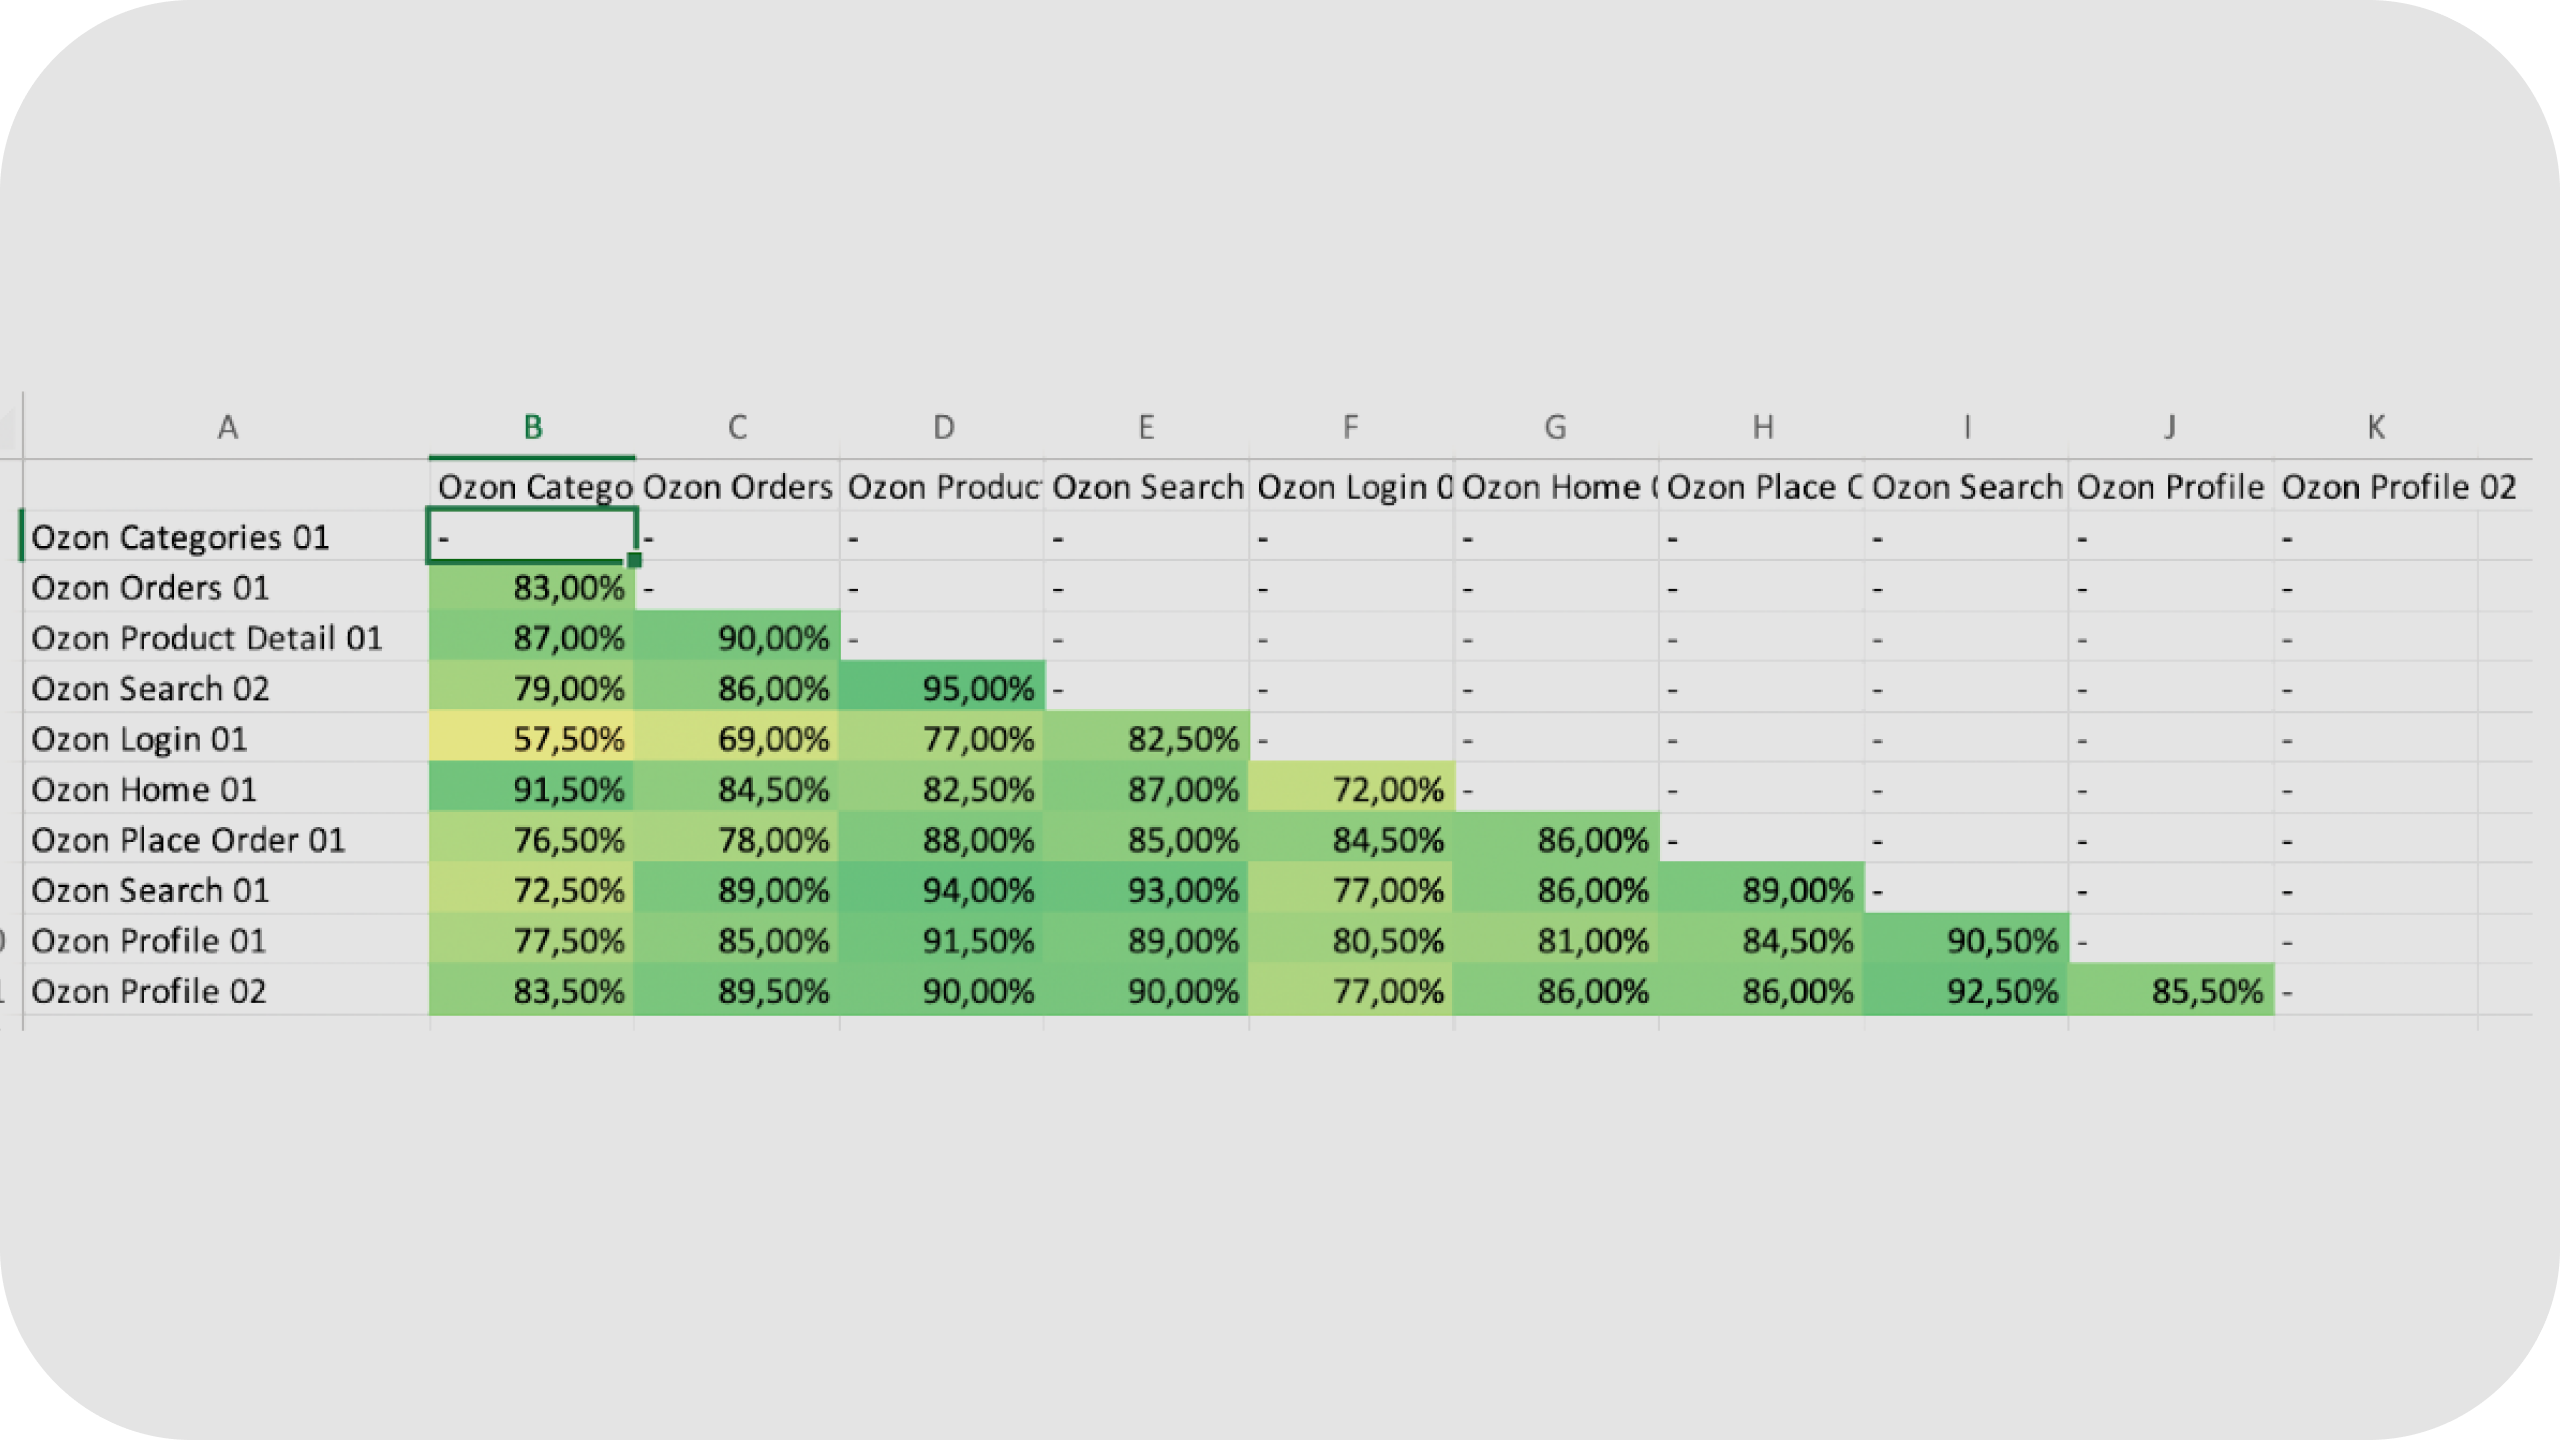 Comparison Score matrix for OZON
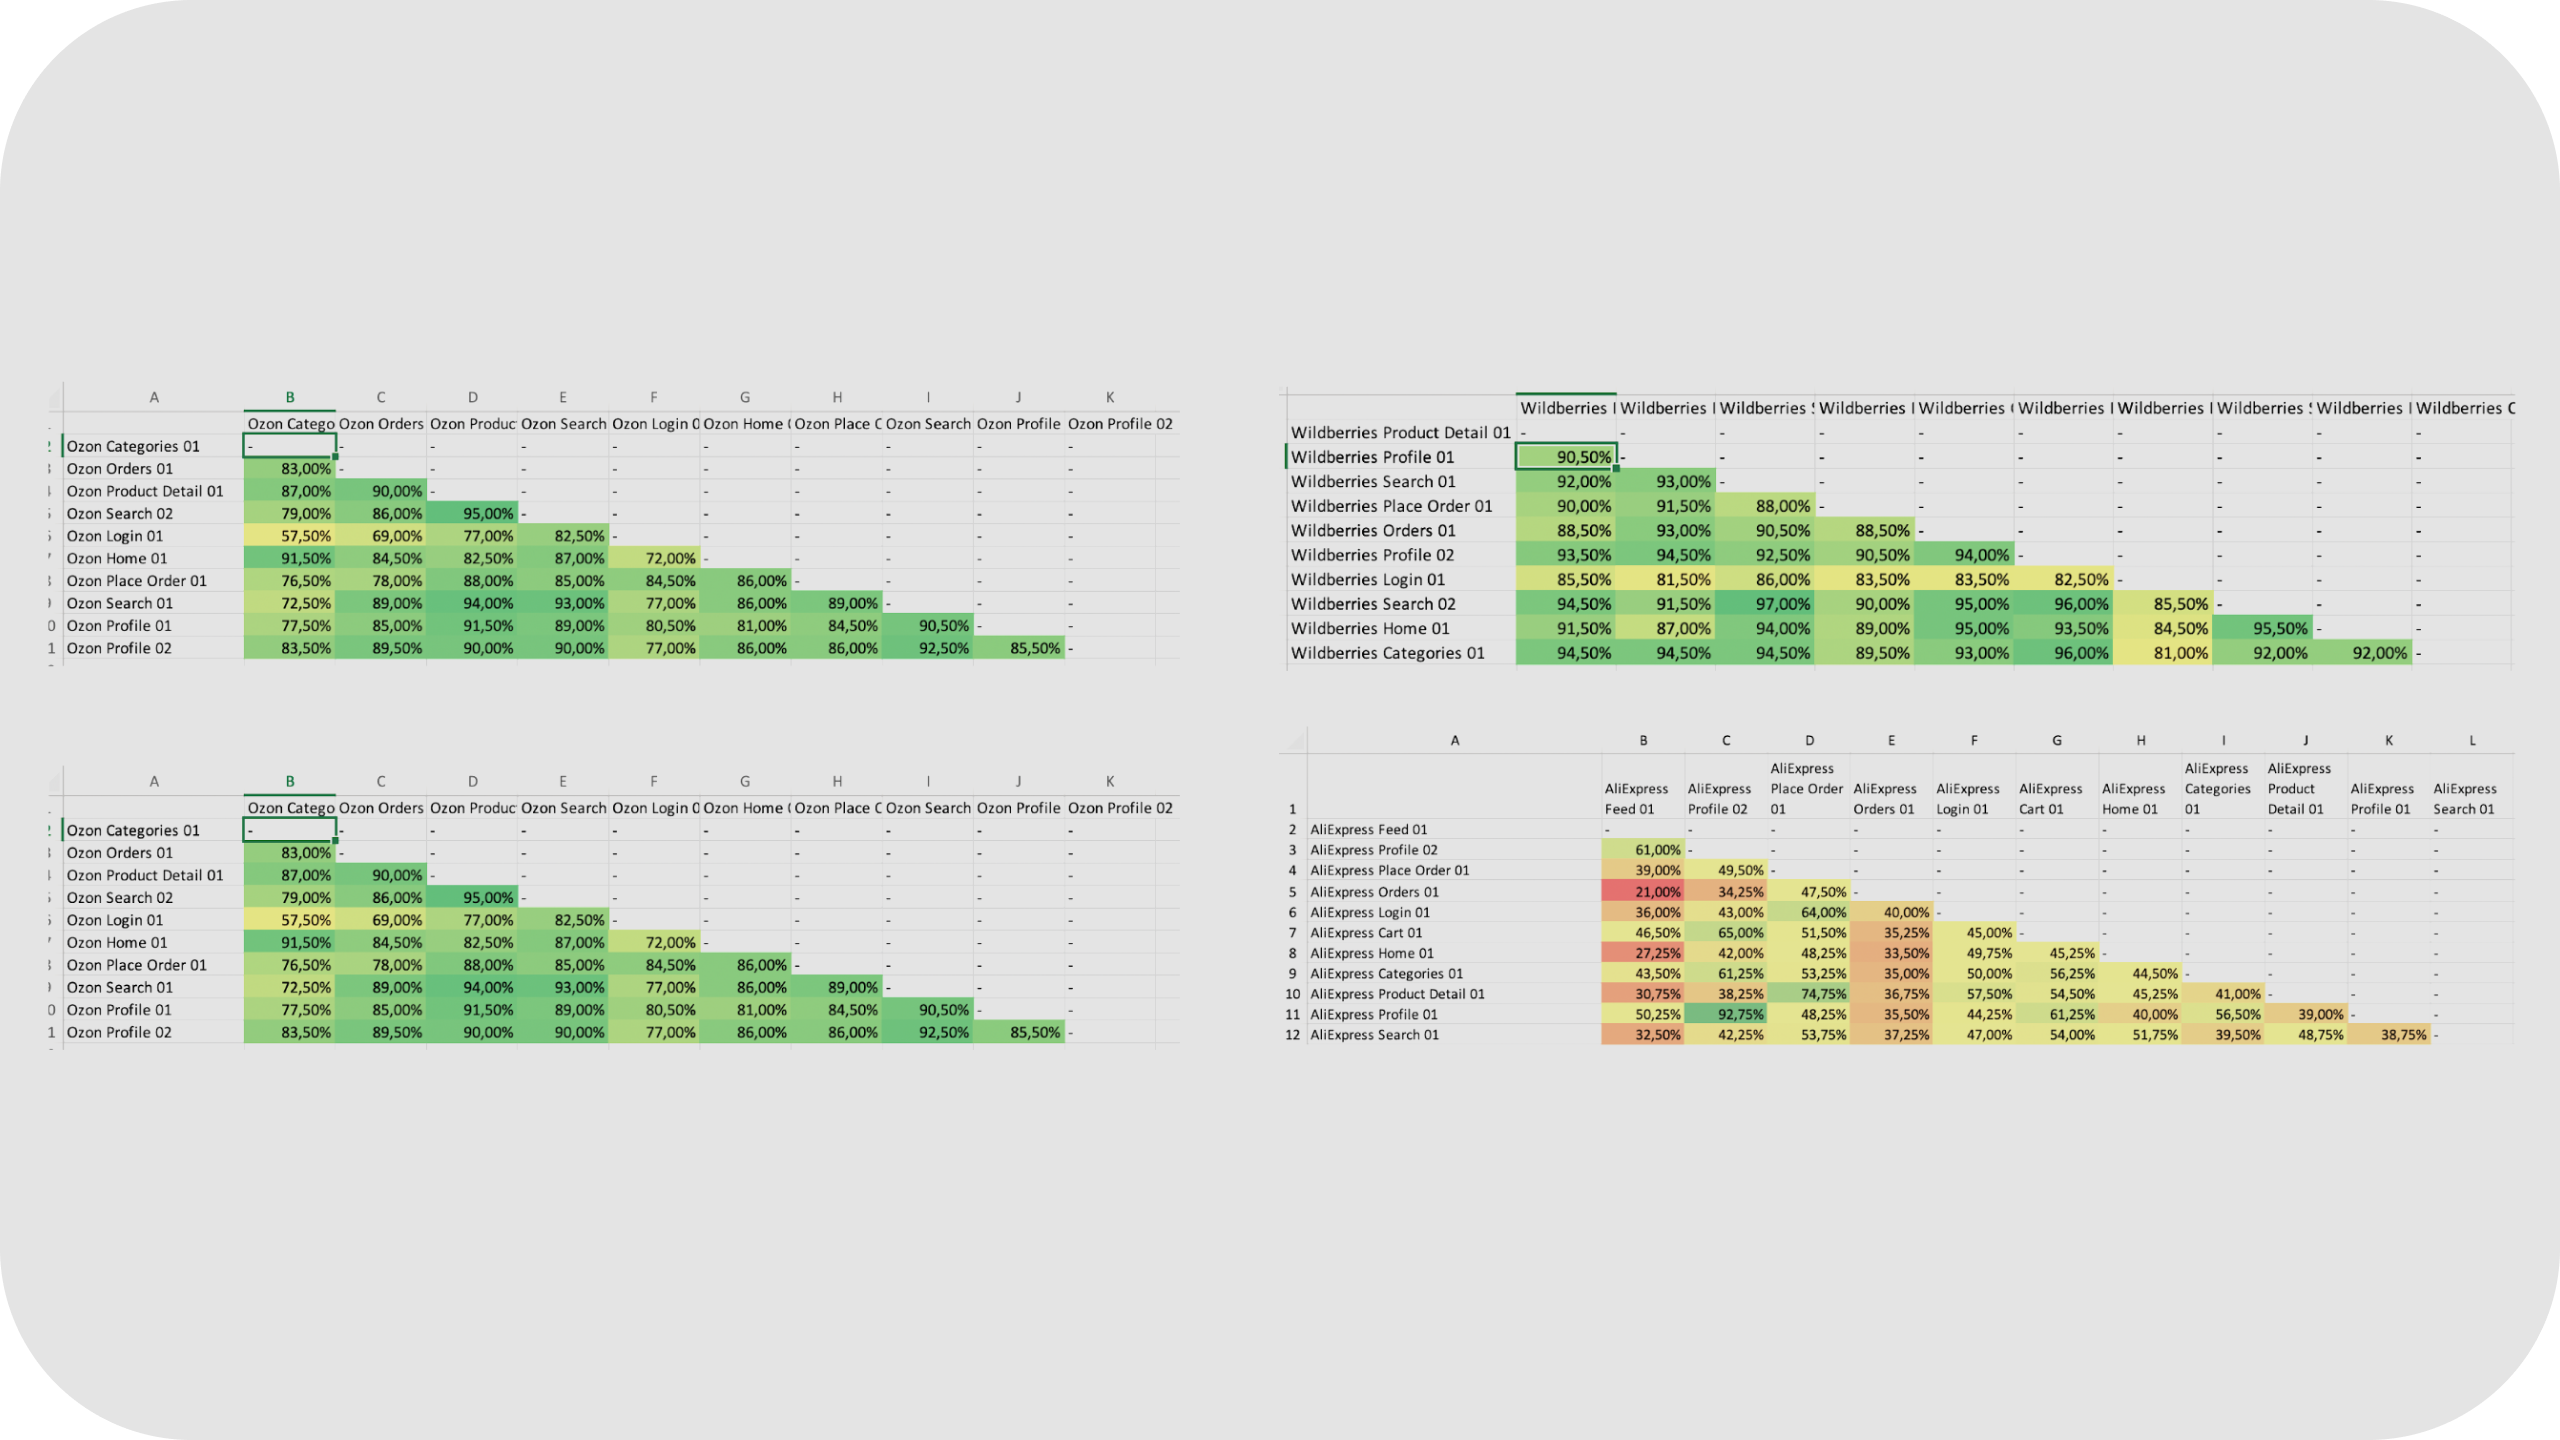
Comparison Score matrixes for OZON, Wildberries, Yandex.Market, AliExpress
Results
For May 2021, we got the following Consistency metric values for us and competition:
In case with AliExpress, there’s definitely something to work on. So, let’s get to work!
Got to product and business — see what’s there in terms of plans for design (in our case, redesign) of new features, screen updates, etc. Remake a set of screens which falls into product roadmap. In half a year (better, in the next quarter) do another evaluation of the consistency metric.
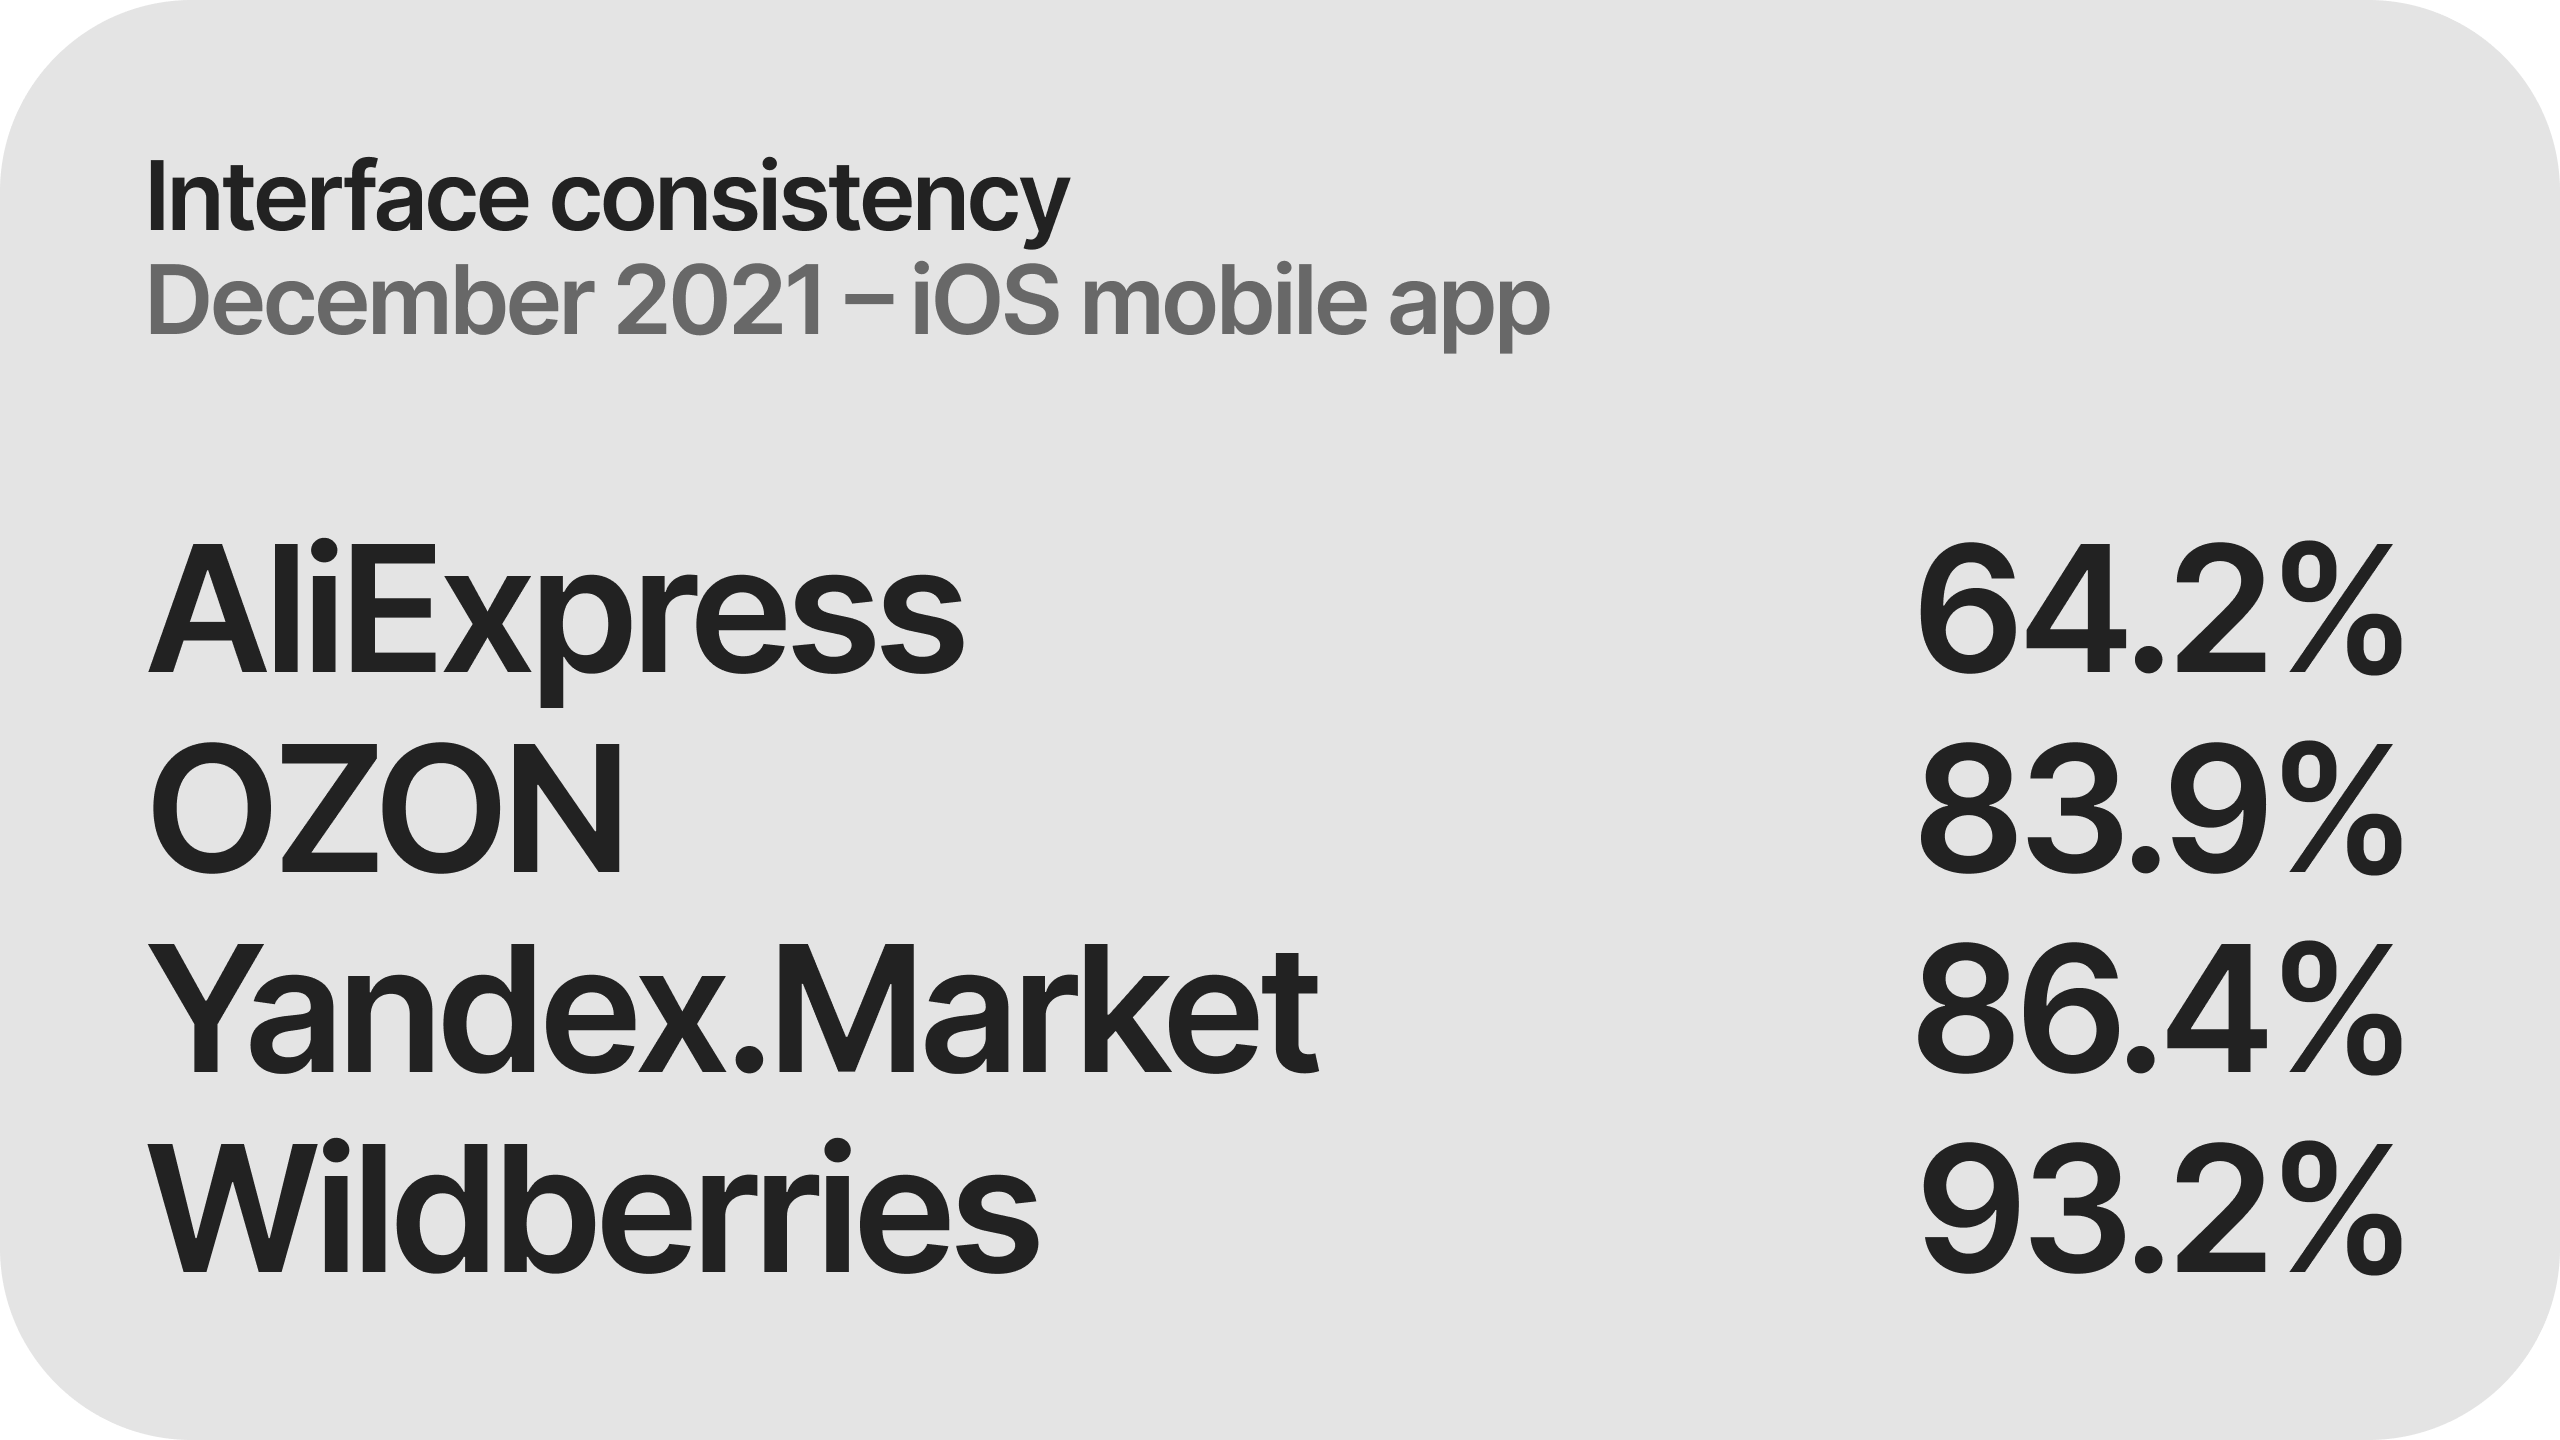
In half a year we get the following result:
AliExpress: 64,2%
Yandex.Market: 86,4%
OZON: 83,9%
Wildberries: 93,2%
In terms of growth and dynamics, we get the following values:
AliExpress is getting a little bit better, but there’s still a lot of room for growth. Iterating on a quarterly basis, we’ll increase the consistency metric and reach the market normal.
- AliExpress: 45.3%
- Yandex.Market: 83.7%
- OZON: 84.0%
- Wildberries: 90.7%
In case with AliExpress, there’s definitely something to work on. So, let’s get to work!
Got to product and business — see what’s there in terms of plans for design (in our case, redesign) of new features, screen updates, etc. Remake a set of screens which falls into product roadmap. In half a year (better, in the next quarter) do another evaluation of the consistency metric.
In half a year we get the following result:
AliExpress: 64,2%
Yandex.Market: 86,4%
OZON: 83,9%
Wildberries: 93,2%
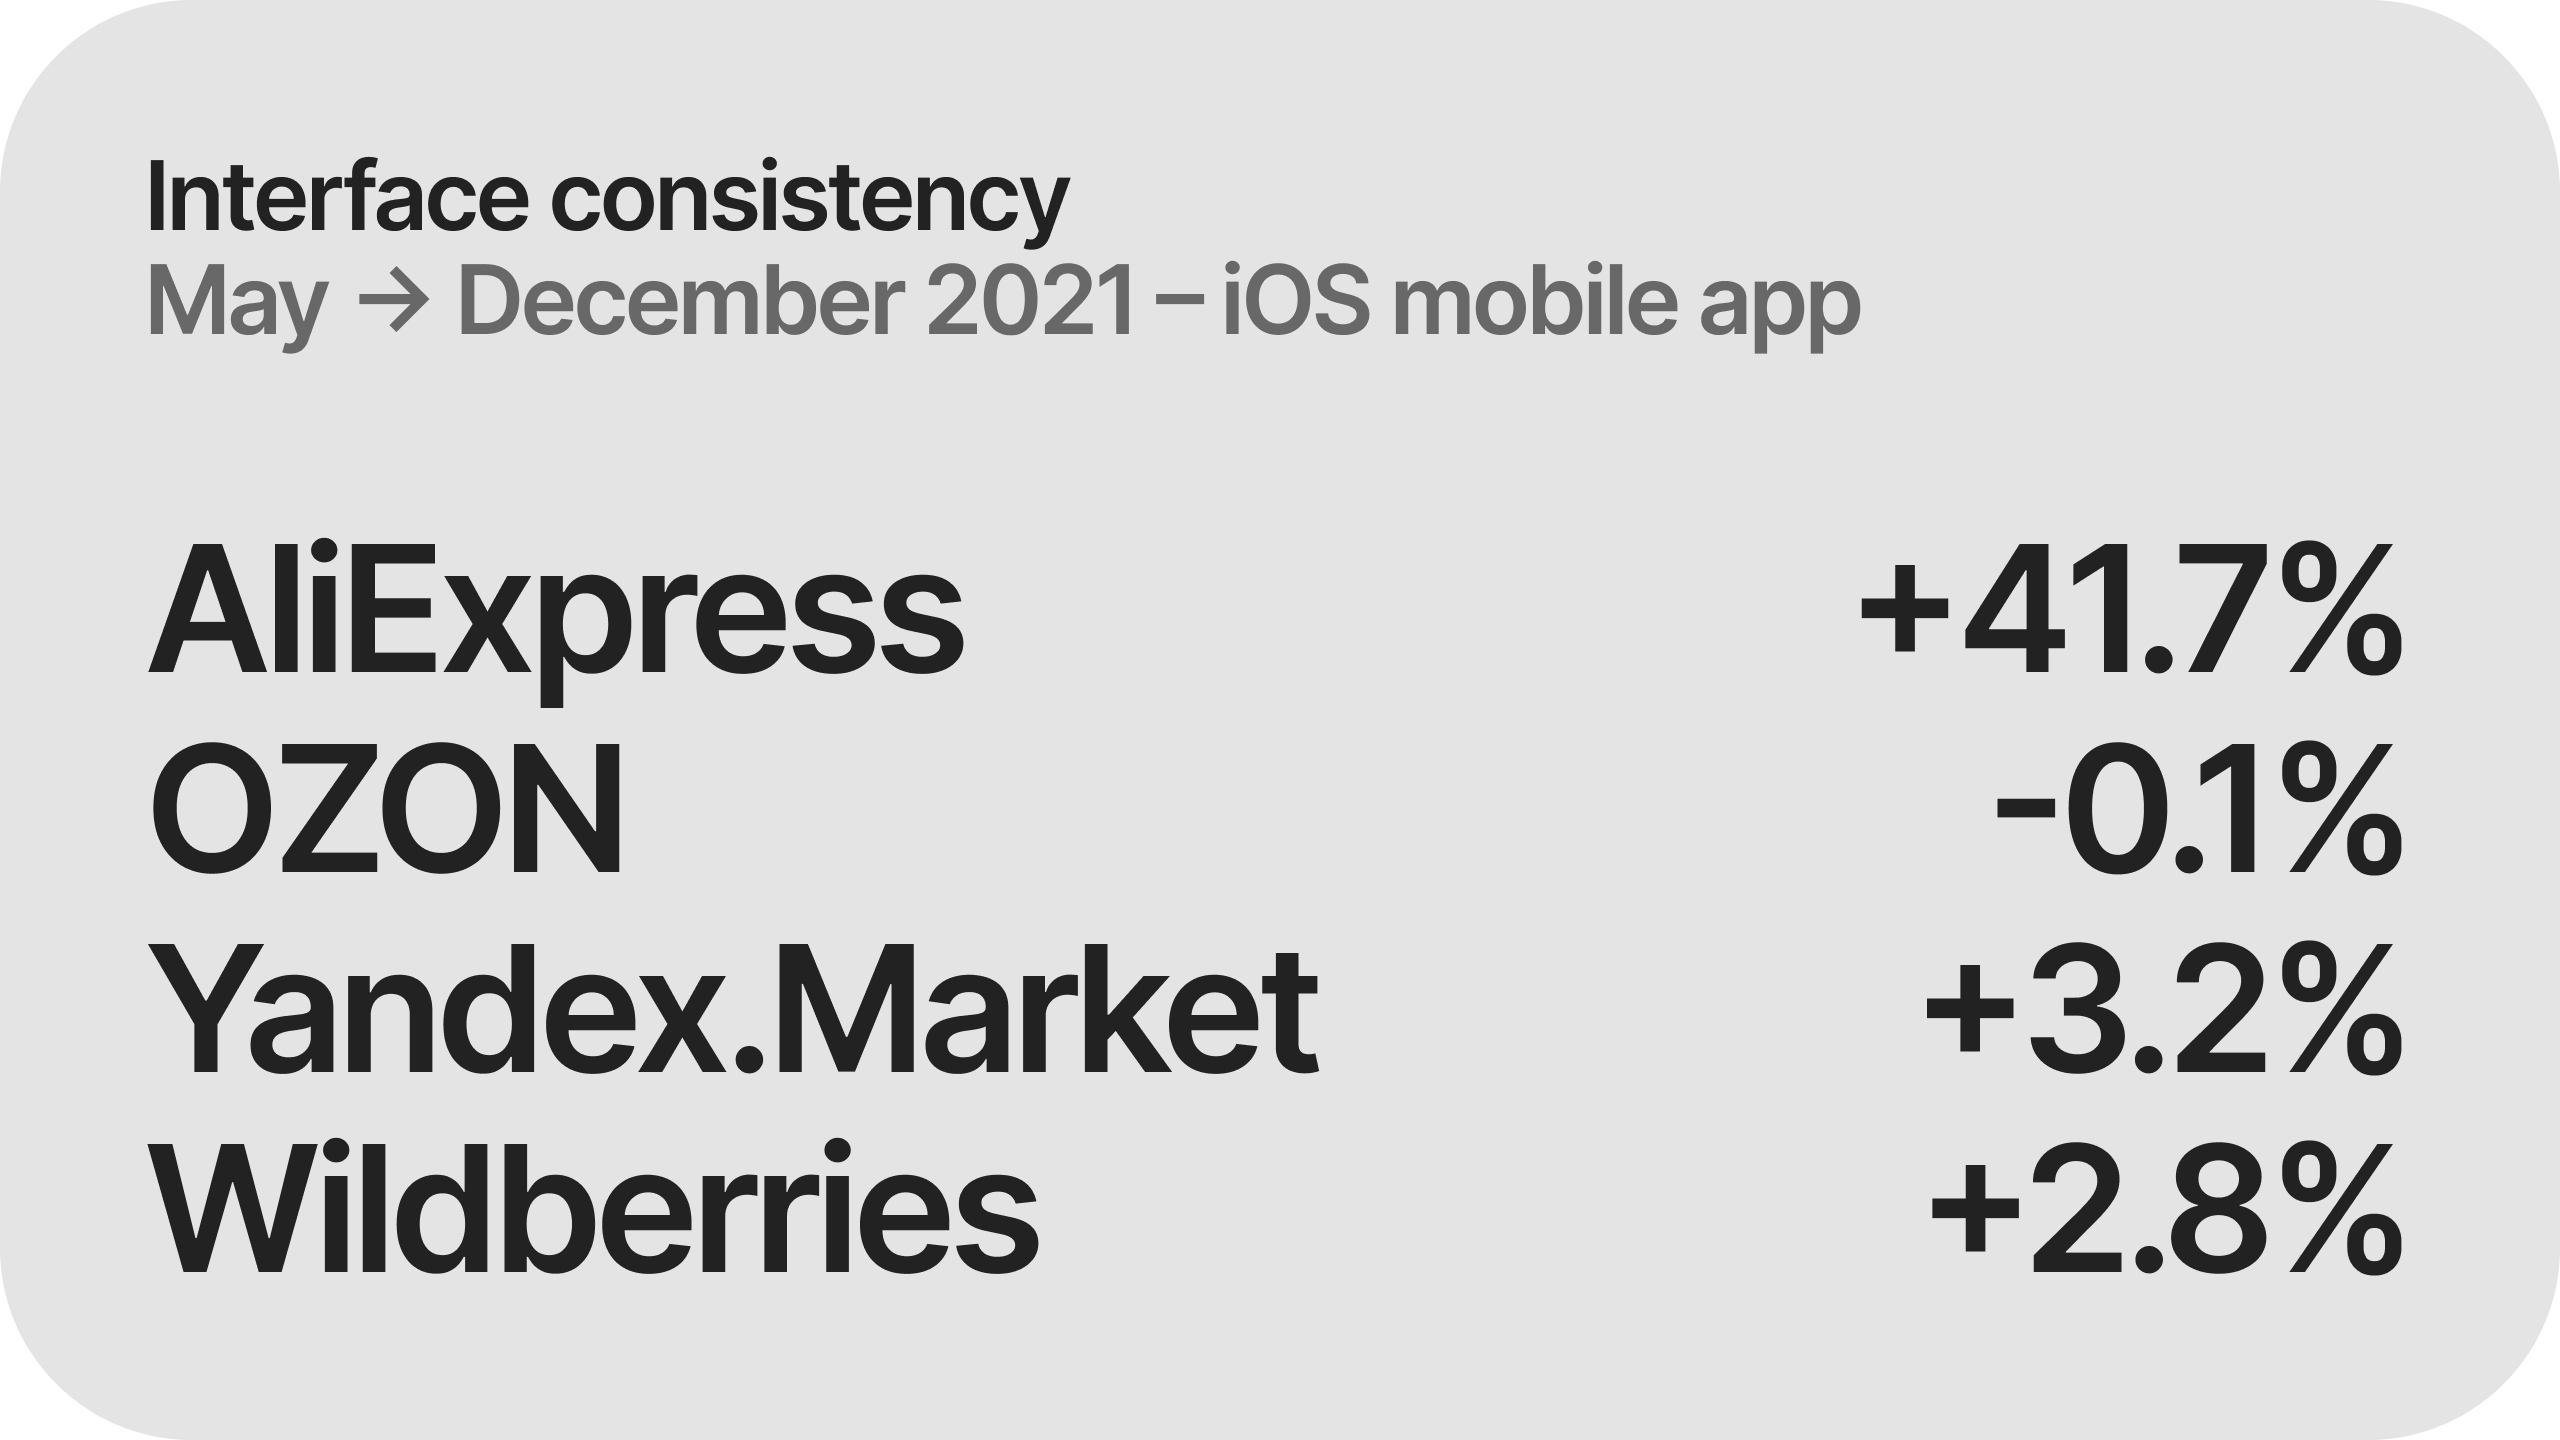
In terms of growth and dynamics, we get the following values:
- AliExpress: 45,3% → 64,2% (+41,7%)
-
OZON: 84,0% → 83,9% (-0,1%)
-
Yandex.Market: 83,7% → 86,4% (+3,2%)
- Wildberries: 90,7% → 93,2% (+2,8%)
AliExpress is getting a little bit better, but there’s still a lot of room for growth. Iterating on a quarterly basis, we’ll increase the consistency metric and reach the market normal.

 Results for May 2021, December 2021 and dynamics of results for marketplaces in Russia & CIS
Not only for production screenshots
You can do all of the above not only for screenshots of production version of the product. You can also do the same measurements for your Figma (or any other software where you create interfaces) mock-ups, and thereby understand whether you are going in the right direction in terms of reaching normal rates for consistency, or whether you are staying at the right level. In this case, you can save up a lot of resource – time, money – for the company.
From the design point of view you can get a “model” screen collection, a standard, if you wish, to which you need to be striving towards to. In our case, with the model screens we’ve been able to get to 77.8% consistency rate, which is very close to the market values.
What can be done next
-
Consistency measurement is only viable if you do it on a regular basis, so you should see how the metric performs in the dynamic of new screens roll-out, and it’s also a nice practice to check it on the model set of screens.
- Test automation with Yandex.Toloka (Amazon Mechanical Turk) for mobile applications and web version of the product. I.e. why spend time to do all those screenshots and manually running the tests?
- Extend the number of platforms to iOS, Android, web – mobile, tablet, desktop.
- Extend the number of products which are being tested, if there’s a necessity for that. For example, you can measure consistency cross-product (we have a product for sellers, affiliate product, infrastructure tools).
- Extend the number of channels which participate in the consistency measurement tests: near product-communication materials like newsletters, performance ads, TV and outdoor materials. Track the communication consistency across all the channels where the brand is present.